Did Boston Have a First-Shot Problem? 2013-14 to 2025-26
Lane: NBA Intelligence Lab. Effective source rating: B (A-rated NBA Stats inputs flowing through a custom B-rated possession parser; proxy-labeled where applicable). Built: 2026-06-11. Pipeline: scripts/firstshot/. All table values are quoted verbatim from the evidence CSVs in data/ (4-decimal precision preserved to avoid re-rounding).
Executive summary
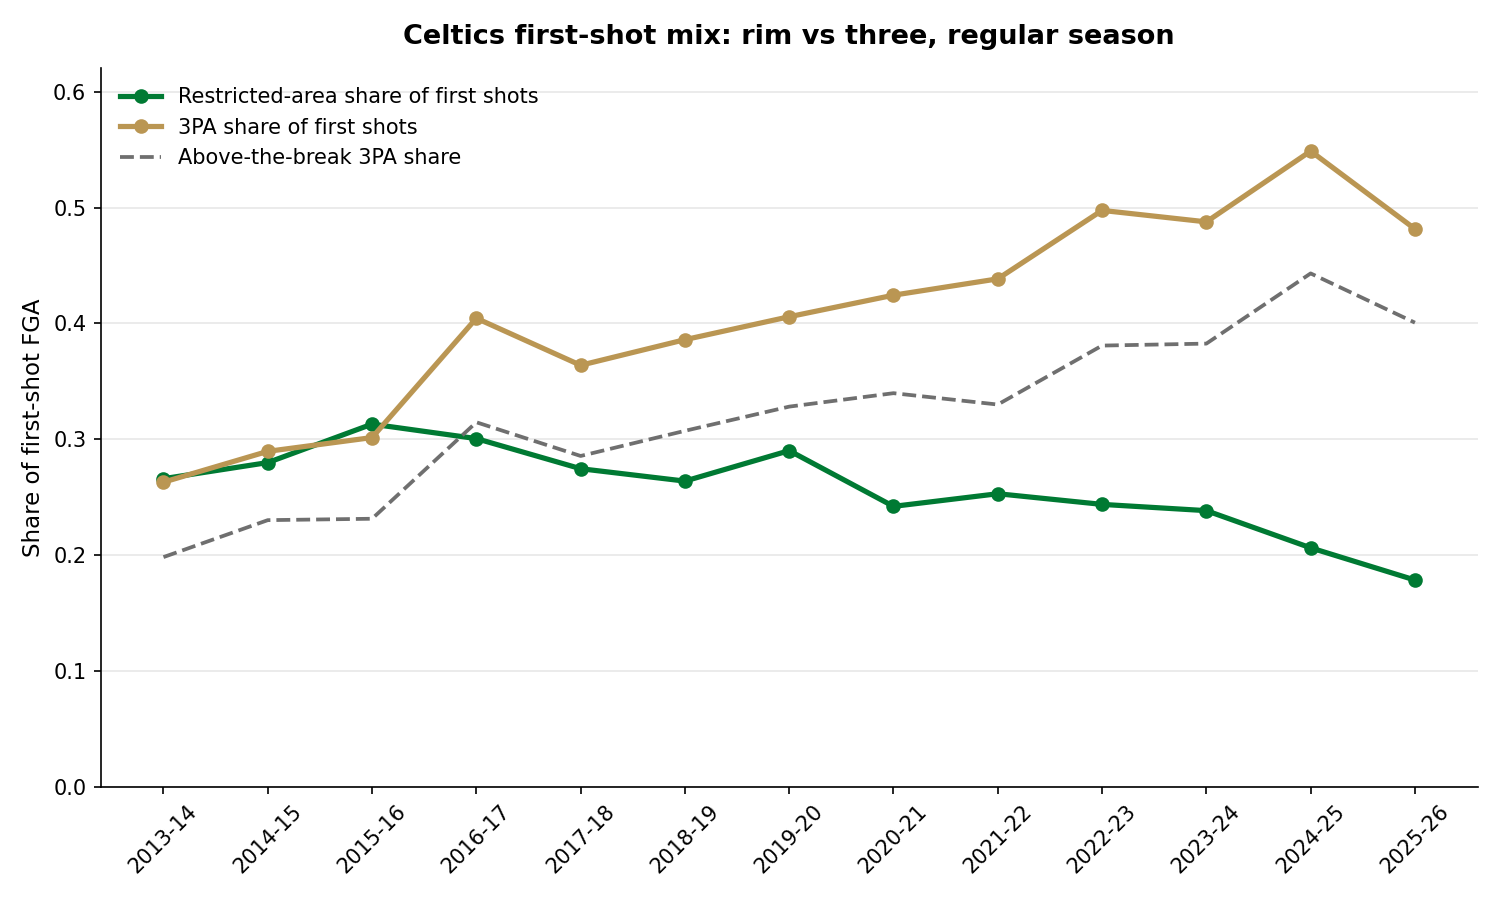
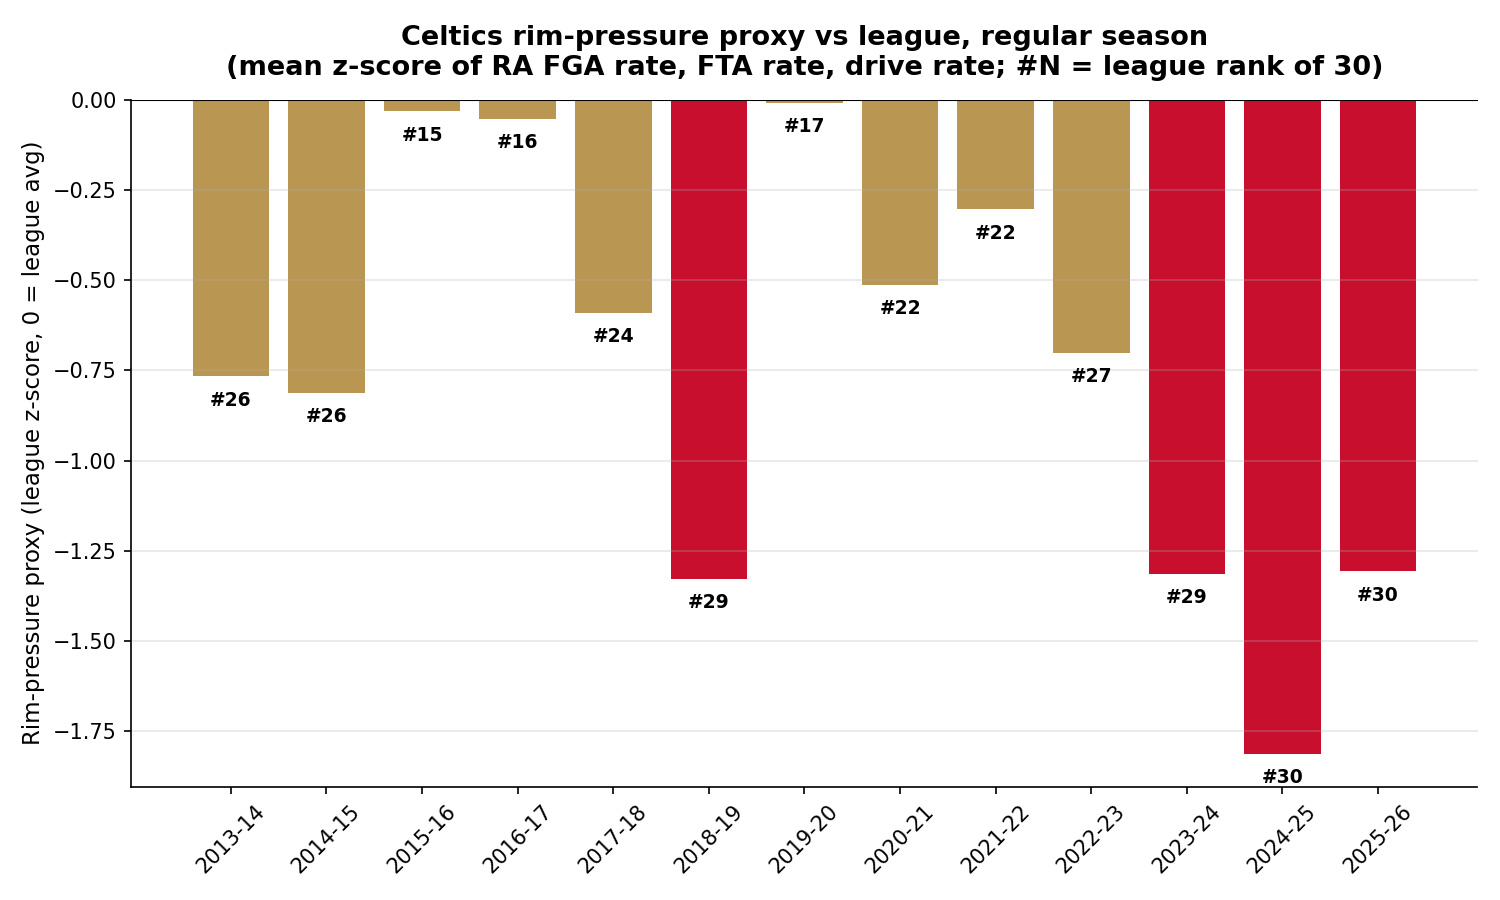
Verdict: Stevens' claim is PARTIALLY SUPPORTED, and the supported part is specific. Boston's first-shot offense did not collapse in output during the 2025-26 regular season (1.1187 points per first-shot FGA, fourth-best of the 13-season span). What changed is the process that creates first shots: the rim-pressure proxy ranked 30th of 30 two seasons running, restricted-area share of first shots hit a 13-year low (.1784), free-throw rate hit a 13-year low, late-shot-clock frequency rose to 2nd-highest in the league (A-rated tracking), and the three-point volume that replaced rim attempts skewed toward pull-up threes (top-4 share in the NBA; pull-up share is a proxy for self-created rather than collapse-created shots, since no public endpoint links a drive or screen to the resulting three, see CEL-Q-006).
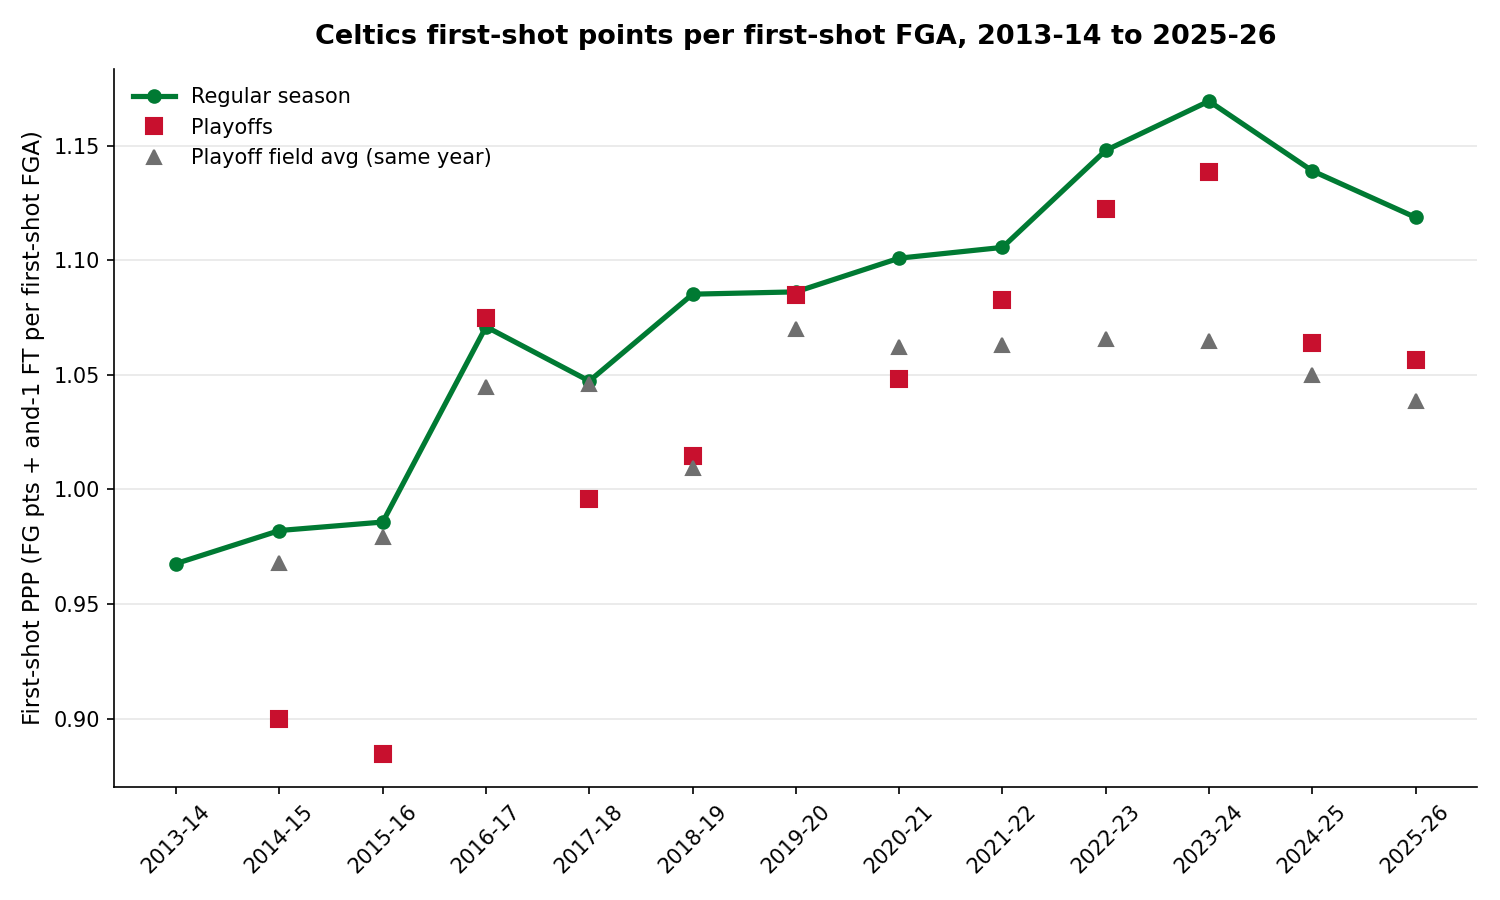
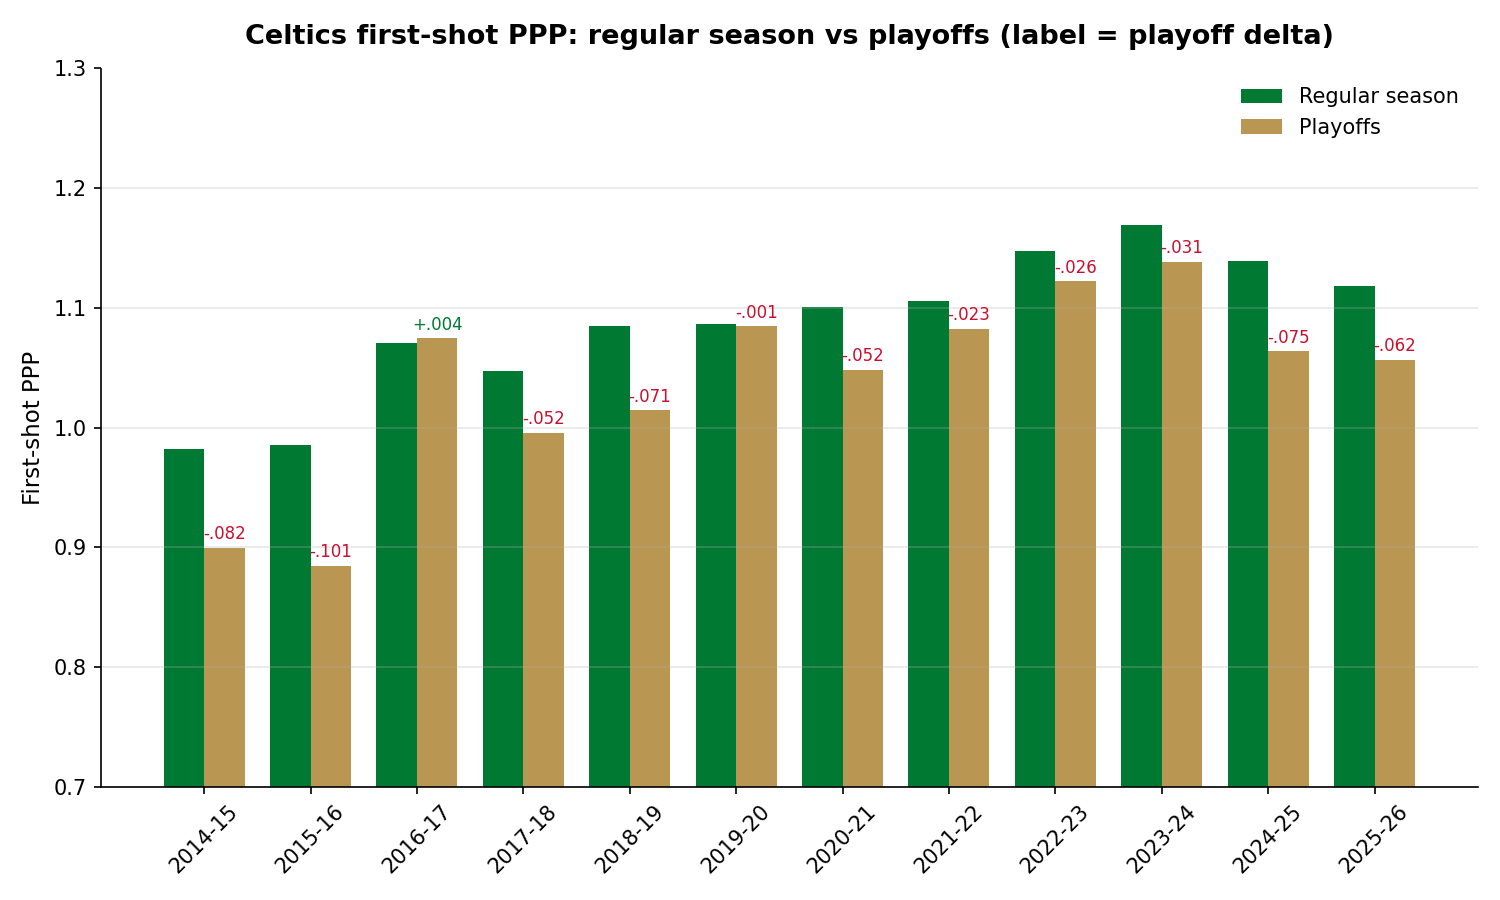
In the playoffs, the chronic regular-season-to-playoff decay repeated: first-shot PPP fell to 1.0567, a drop (-.0620) close to the era-long average gap (-.0477), while the first-shot profile got more three-heavy (.5236, the highest playoff three-rate of the era). Against the full playoff field (all 1,088 league playoff games parsed with the same engine), 1.0567 still ranked 7th of 16 playoff teams, above the field average of 1.0384, but below the final-four average of 1.0968 for the second straight year. Stevens' quote describes a contender that slipped below contender standard, not a broken offense.
The 13-year arc: first-shot efficiency rose almost monotonically from 0.9677 (2013-14) to a peak of 1.1694 (2023-24, title season), then declined two straight years while the shot mix kept drifting away from the rim. Boston won a championship with a version of this style in 2023-24; the 2025-26 version kept the style but lost the rim pressure, the foul pressure, and the shotmaking margin that the title version had.
Answers to the five framing questions:
| Question | Answer |
|---|---|
| Mostly a style issue? | No. The style (three-heavy first shots) was compatible with a title in 2023-24. |
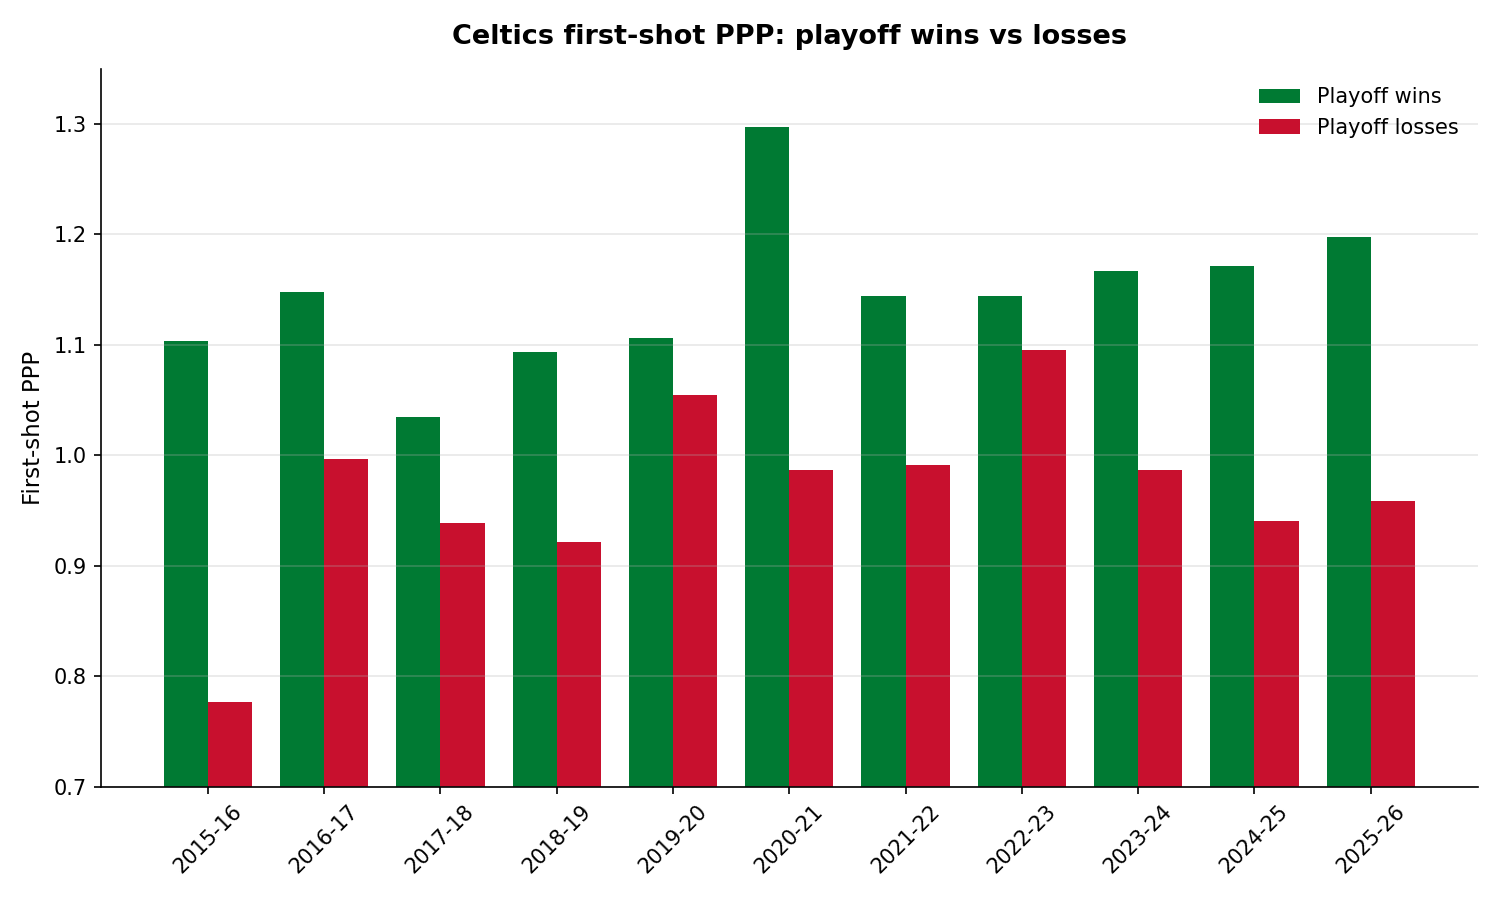
| Mostly an output issue? | Partially. 2025-26 playoff losses show a shotmaking collapse on a similar shot mix (PPP .9582 in losses vs 1.1972 in wins, with lower no-shot turnover rate in losses; single series, small n). |
| Mostly a personnel / rim-pressure issue? | The strongest signal, with a labeled limit. Drives recovered to league average (47.43/game vs 47.99) in 2025-26 while restricted-area FGA fell to an era low (18.96/game) and FTA rate to an era low (.2074). The aggregate pattern is consistent with drives ending in kick-outs and pull-ups instead of rim attempts and fouls. Public data cannot separate "personnel cannot finish" from "scheme converts drives to kick-outs by design"; both produce these aggregates (see Next research steps). |
| Mostly a playoff-specific issue? | Partially. First-shot PPP fell from regular season to playoffs in 11 of 12 playoff seasons (one-sided sign test p = 0.003, two-sided 0.006), so playoff decay is chronic, not new. The 2024-26 specific failure: above playoff-field average, below final-four average, twice. |
| Mostly a two-star structure issue? | Suggestive, not provable with public data. Top-4 pull-up 3PA share plus rank-30 rim-pressure proxy is the statistical silhouette of self-created perimeter offense; event-level proof requires Synergy-grade data (CEL-Q-006). |
The quote being tested
Brad Stevens, end of season 2025-26: "We had a really hard time generating good looks on that first shot."
The quote is treated as a hypothesis, not a fact. It decomposes into testable parts: (1) first-shot efficiency, (2) first-shot shot quality (location mix), (3) the creation process behind first shots (rim pressure, clock usage, assist/creation type), (4) regular season vs playoffs.
Methodology
Possession parsing. Every Celtics game from 2013-14 through 2025-26 (1,205 games: 1,044 regular season, 161 playoffs) was parsed from NBA Stats PlayByPlayV3 with a custom state machine (scripts/firstshot/possession_parser.py). A possession ends on a made FG (including the and-1 FT), a made final FT, a defensive rebound, a turnover, or the period horn. Two implemented exceptions to the FT rule: flagrant and clear-path free throws score to the current chance and do NOT end the possession (offense retains the ball), and technical free throws are excluded from possession scoring entirely (tracked separately). Chance 1 is everything before the first offensive rebound, where "offensive rebound" includes deadball team rebounds credited to the offense (e.g., a miss knocked out of bounds by the defense); that convention expels the post-deadball inbound shot from first-shot metrics and differs from some public possession parsers, which treat deadball team rebounds as non-events. The first shot is the first FGA of chance 1; anything after an offensive rebound is second-chance and excluded. End-of-period heaves are NOT excluded (sensitivity quantified in Caveats).
Validation. Across all 2,410 Celtics team-games, parsed FGA and turnovers reconcile 100.0% against the play-by-play event counts; parsed points reconcile 99.92% (2 team-games off by 3-5 points, both caused by missing scoring rows in the source PBP for New Orleans, with the score columns proving the gap). The 2,176 league-playoff team-games reconcile 100.0% on all three checks. Parsed possessions per game track published league pace within ~0.5 possessions (94.1 in 2013-14, 100.3 in 2018-19, 98.2 in 2023-24).
Definitions
first_shot_ppp= (FG points + and-1 FT points on first shots) / first-shot FGA.first_shot_efg= (FGM + 0.5 x 3PM) / FGA on first shots. PPP and eFG differ only by and-1s.first_chance_ppp= all non-technical points earned before any offensive rebound (including free-throw trips earned before a shot) / total possessions. This is the fullest "first crack at the defense" measure.first_shot_ts_proxy= chance-1 points / (2 x (first-shot FGA + 0.44 x chance-1 FTA)). This is chance-1 true shooting, not shot-level TS; the numerator includes FT-trip-only possessions.no_shot_turnover_rate= possessions with a turnover before any FGA / possessions.late-clock proxy= share of first shots taken 18+ seconds after the possession began, computed only on clean-start possessions (after an opponent score, defensive rebound, turnover, or period start; no mid-possession foul, violation, or replay review; possession started with at least 18 seconds on the game clock). The proxy runs high in absolute terms because the game clock runs during made-basket inbounds, and that bias moves with the start-reason mix; it is used for direction only. NBA tracking shot-clock buckets (A-rated, all shots, not first shots) are quoted for levels and ranks.rim_pressure_proxy= mean of within-season league z-scores of: restricted-area share of FGA, FTA/FGA, and drives per possession (all 30 teams, A-rated sources). 0 = league average for that season; z-magnitudes are not comparable across seasons (league spread changes), so prose leans on ranks. Playoff rows of this proxy in the CSV are z-scored within the ~16-team playoff field, not the 30-team league, and are flagged in the notes column; the report quotes regular-season values only.
Data sources
See data/celtics_first_shot_sources_audit.csv for the full audit (endpoint, seasons, fields, limitations, confidence per dataset). All sources are public NBA Stats API endpoints via nba_api. No Synergy, Second Spectrum, or paid data. Tracking-era endpoints (drives, shot clock, pull-up/catch-and-shoot) begin exactly 2013-14; the tracking vendor changed twice across the span (SportVU, Second Spectrum, Hawk-Eye), so cross-era drive levels are approximate.
Comparison baselines. League playoff baselines come from parsing all 1,088 league playoff games 2013-14 to 2025-26 with the same parser (data/processed/firstshot/league_po_first_shot_baselines.csv). League REGULAR-SEASON first-shot baselines would require ~16,000 games and were not pulled (CEL-Q-005); regular-season comparisons use league-wide component baselines (rim rate, FTA rate, drives, shot-clock buckets; A-rated, complete) plus an opponent-vs-BOS proxy that is biased by Boston's defense quality and labeled as such in the CSV.
What public data can prove
- First-shot identification per possession (PBP-exact, validated as above).
- First-shot location mix (shot chart join matched 99.97-100% of first shots).
- Rim pressure components vs all 30 teams, every season (A-rated).
- Shot-clock usage vs all 30 teams (A-rated tracking, all shots).
- Playoff first-shot baselines for every playoff team 2014-2026 (same engine, 100% reconciliation).
What public data cannot prove
- Whether a specific three was "created by real defensive collapse." No public endpoint links a screen, drive, or kick-out to the resulting 3PA (DATA_SEMANTICS Sections 1 and 8; CEL-Q-006). Pull-up vs catch-and-shoot share and the drives-vs-rim-conversion gap are the honest proxies and are labeled proxy wherever used.
- Assisted rates on missed shots (assists exist only on makes in PBP).
- True shot-clock values per shot (proxy + tracking buckets instead).
- Defender distance on first shots specifically (closest-defender tracking covers all shots only).
Season-by-season table (regular season)
Evidence: data/celtics_first_shot_offense_by_season.csv and data/celtics_shotclock_tracking_by_season.csv. Values verbatim. Late-clock share and rank both come from the league-recalculated series (bos_late_share_7_0_leaguecalc, bos_late_share_rank) so value and rank are one series.
| Season | First-shot PPP | First-shot eFG | 3PA share of first shots | RA share of first shots | No-shot TO rate | Rim-pressure proxy (rank/30) | Late-clock share, tracking (rank/30) |
|---|---|---|---|---|---|---|---|
| 2013-14 | 0.9677 | .4751 | .2629 | .2659 | .1440 | -0.77 (26) | .2082 (17) |
| 2014-15 | 0.9821 | .4834 | .2895 | .2798 | .1268 | -0.81 (26) | .1456 (29) |
| 2015-16 | 0.9858 | .4838 | .3014 | .3130 | .1254 | -0.03 (15) | .1943 (29) |
| 2016-17 | 1.0710 | .5256 | .4044 | .3005 | .1212 | -0.05 (16) | .1792 (14) |
| 2017-18 | 1.0473 | .5158 | .3638 | .2745 | .1286 | -0.59 (24) | .1723 (16) |
| 2018-19 | 1.0852 | .5337 | .3859 | .2638 | .1157 | -1.33 (29) | .1462 (26) |
| 2019-20 | 1.0862 | .5332 | .4057 | .2901 | .1227 | -0.01 (17) | .1627 (19) |
| 2020-21 | 1.1009 | .5420 | .4243 | .2420 | .1240 | -0.51 (22) | .1765 (16) |
| 2021-22 | 1.1056 | .5413 | .4384 | .2529 | .1225 | -0.30 (22) | .1859 (13) |
| 2022-23 | 1.1479 | .5635 | .4975 | .2437 | .1182 | -0.70 (27) | .1731 (19) |
| 2023-24 | 1.1694 | .5765 | .4876 | .2383 | .1060 | -1.31 (29) | .1839 (14) |
| 2024-25 | 1.1390 | .5621 | .5487 | .2062 | .1072 | -1.81 (30) | .1999 (9) |
| 2025-26 | 1.1187 | .5511 | .4815 | .1784 | .1083 | -1.31 (30) | .2340 (2) |
Reading: efficiency rose for a decade because the mix shifted to threes AND the threes went in. The last two rows are the regime change: rim share collapsed to 13-year lows, the rim-pressure proxy went 30th twice, and in 2025-26 the late-clock share (tracking, A-rated, all shots) jumped to 2nd-highest in the NBA at .2340 against a league average of .1765; the prior 12 Boston seasons never ranked better than 9th on that measure.
Regular season vs playoffs
Evidence: data/celtics_first_shot_offense_by_season.csv (playoff rows) and data/processed/firstshot/league_po_group_baselines.csv. First-shot PPP fell from regular season to playoffs in 11 of 12 playoff seasons (only 2016-17 was flat-positive, +.0037). Mean per-season gap -.0477, possession-weighted pooled gap -.0233 (pooled RS 1.0870, pooled PO 1.0637). One-sided sign test p = 0.003 (two-sided 0.006); seasons share personnel, so the 12 trials are not fully independent. Some drop is expected against playoff defenses; the field context below shows where Boston stood among playoff teams each year.
Boston vs the playoff field (all 1,088 league playoff games parsed with the same engine)
| Season | BOS PO first-shot PPP | Playoff field avg | BOS rank /16 | Final-four avg | Champion (value) |
|---|---|---|---|---|---|
| 2014-15 | 0.8997 | 0.9679 | 13 | 1.0030 | GSW (1.0539) |
| 2015-16 | 0.8846 | 0.9791 | 14 | 1.0363 | CLE (1.0886) |
| 2016-17 | 1.0747 | 1.0446 | 4 | 1.1217 | GSW (1.1662) |
| 2017-18 | 0.9957 | 1.0458 | 14 | 1.0471 | GSW (1.1053) |
| 2018-19 | 1.0145 | 1.0093 | 8 | 1.0579 | TOR (1.0455) |
| 2019-20 | 1.0848 | 1.0698 | 7 | 1.1068 | LAL (1.1571) |
| 2020-21 | 1.0484 | 1.0620 | 10 | 1.0878 | MIL (1.0509) |
| 2021-22 | 1.0826 | 1.0629 | 7 | 1.0933 | GSW (1.1298) |
| 2022-23 | 1.1223 | 1.0655 | 4 | 1.1047 | DEN (1.1481) |
| 2023-24 | 1.1387 | 1.0646 | 2 | 1.1321 | BOS (1.1387) |
| 2024-25 | 1.0641 | 1.0501 | 6 | 1.0802 | OKC (1.0610) |
| 2025-26 | 1.0567 | 1.0384 | 7 | 1.0968 | in progress (NYK 3-1 SAS, 2026-06-10) |
Three reads:
- Boston's playoff first-shot output was not bad relative to the playoff field, even in 2025-26 (7th of 16, above the field average). The Stevens quote is not describing a bottom-of-field offense.
- The bar Boston stopped clearing is the final-four average. They beat it in 2022-23 (+.018) and 2023-24 (+.007); they missed it in 2024-25 (-.016) and 2025-26 (-.040). Champions usually live near the top of this metric (GSW 2017 1.1662, LAL 2020 1.1571, DEN 2023 1.1481, BOS 2024 1.1387); the grind-it-out exceptions are TOR 2019, MIL 2021, and OKC 2025.
- Rim-share context cuts both ways. BOS 2025-26 had the 2nd-lowest first-shot rim share of the 16 playoff teams (.1871; only PHX lower), against a field average of .2532. But the 2021-22 champion GSW carried a .1642 playoff rim share to a title with the No. 1 first-shot PPP of that field (1.1298). A low-rim playoff profile is survivable only with top-of-field shotmaking, which Boston had in 2023-24 and lacked in 2025-26.
Playoff wins vs playoff losses
Evidence: data/celtics_first_shot_playoff_wins_losses.csv. Losses had worse first-shot PPP than wins in 11 of 11 playoff seasons with both (mean gap .178). This is partially mechanical (you lose when shots miss), so the informative part is the composition of losses (directional; per-season loss samples are 3-10 games):
| Season | PPP W | PPP L | 3PA share W | 3PA share L | No-shot TO W | No-shot TO L |
|---|---|---|---|---|---|---|
| 2021-22 | 1.1442 | 0.9914 | .4705 | .4592 | .1161 | .1689 |
| 2022-23 | 1.1440 | 1.0953 | .4699 | .4736 | .1112 | .1196 |
| 2023-24 | 1.1671 | 0.9865 | .4996 | .4775 | .0993 | .1043 |
| 2024-25 | 1.1714 | 0.9405 | .4765 | .5054 | .0950 | .1519 |
| 2025-26 | 1.1972 | 0.9582 | .5459 | .5080 | .1151 | .1013 |
Two loss signatures appear in the recent window. 2021-22 and 2024-25 losses: no-shot turnover spikes (the "no good look because no shot at all" failure). 2025-26 losses: turnover rate actually improved and the mix barely moved; the shots simply missed (PPP -.239 vs wins). The 2025-26 playoff exit was a first-round loss to Philadelphia in seven games (3 wins, 4 losses; game list with results in data/processed/firstshot/bos_games_all.csv): an output collapse on a process that was already the most three-dependent and least rim-pressured of the era.
Playoff games with an 8+ point second-half lead
Season-level table in data/celtics_first_shot_prosperity_games.csv (one row per season; "second half" includes overtime); possession-level split in data/celtics_first_shot_while_leading8_2h_playoffs.csv. The blown-lead narrative does NOT run through first-shot offense: pooled across 2013-26 playoffs, Boston's first-shot PPP while holding an 8+ second-half lead was 1.1635 vs 1.0437 in all other playoff possessions, and the lead-possession number is higher in all 11 seasons with lead possessions (2025-26: 1.3855 vs 0.9955). Caveats: leading correlates with that night's shotmaking and includes some garbage time; the 2015-16 lead sample is only 10 first shots. Directional only. But there is no evidence Boston's first-shot process decayed while ahead.
First-shot quality trend
Evidence: data/celtics_first_shot_offense_by_season.csv.
- Improved 2013-2024, declined since. First-shot eFG: .4751 to .5765 peak (2023-24), then .5621 and .5511.
- No-shot turnovers improved across the era. From .1440 (2013-14) to .106-.108 in the last three seasons, the best ball-security stretch of the 13 years. Stevens' problem was not turnovers.
- Free-throw pressure vanished. FT-trip-before-shot rate fell to .0697 in 2025-26, the era low (era range .0697-.0957); team FTA/FGA .2074 vs league .2638, the widest deficit of the span.
Rim-pressure trend
Evidence: data/celtics_rim_pressure_by_season.csv. First, the constant: Boston's rim-pressure proxy was below league average in all 13 seasons of this study. This is a franchise identity across the Stevens-coach and Stevens-GM eras, not a recent accident. What changed recently is degree: from mildly below average (ranks 15-27) to last in the league (rank 30 in 2024-25 and 2025-26).
The 2025-26 paradox is the report's sharpest finding: drives jumped to 47.43/game (league avg 47.99, Boston's closest-to-average drive volume since 2019-20) yet produced only 18.96 restricted-area FGA/game (share .2102, worst gap to the league's .2839 in the span) and the era-low FTA rate (.2074). In 2024-25 the problem was drive volume (36.83/game vs league 47.05); in 2025-26 the volume recovered but the conversion did not. The aggregate pattern (proxy; no public drive-to-outcome link exists) is consistent with drives ending in kick-outs and pull-ups instead of rim attempts and fouls. What the data rules out is a refusal to drive. What it cannot rule out is a scheme that deliberately converts drives into kick-outs; the player-level split in Next research steps is the test that separates "cannot finish" from "chooses not to."
Three-point profile
Evidence: data/celtics_first_shot_offense_by_season.csv (zone shares), data/celtics_first_shot_zone_profile_by_season.csv, data/celtics_shot_creation_by_season.csv.
- 3PA share of first shots: .2629 (2013-14) to .5487 (2024-25 peak), .4815 in 2025-26, then .5236 in the 2025-26 playoffs, the highest playoff three-rate of the era, in the series they lost.
- Above-the-break share of first shots roughly doubled (.1982 to .4006-.4431); corner share peaked mid-era (.1078-.1161 in 2021-23) and fell to .0809-.1056 in the last two seasons. The marginal threes added recently were above-the-break threes, the lowest-value three.
- Assisted share of made first-shot 3s drifted from ~.85 (2014-16) to .78 (2024-26) [makes only, PBP limit].
- Pull-up 3PA share (tracking, all shots; proxy for self-created threes): league rank 3rd (2024-25, .3539 vs league avg .2930) and 4th (2025-26, .3509 vs .2723). Combined with the rank-30 rim-pressure proxy, the statistical profile is "threes created off the dribble, not off collapse." Event-level confirmation is not possible publicly (CEL-Q-006).
Output vs style conclusion
High 3PA volume with strong rim pressure and open threes is good process; high 3PA volume with a rank-30 rim-pressure proxy, league-low foul pressure, and the league's 2nd-most late-clock shots is the problematic version. Boston ran the first version in 2022-24 (won a title at .4876 first-shot three rate with league-median clock usage and 47.05 paint points/game) and drifted into the second version by 2025-26. The quote survives as a process diagnosis even though the regular-season output stayed top-four-of-era. What it is NOT: a turnover problem (era-best), a lead-protection problem (lead possessions were their best possessions), or a simple "too many threes" problem (the 2023-24 champion took nearly as many).
Roster archetype implications
Measured facts (evidence: data/celtics_rim_pressure_by_season.csv): drives recovered to league average while rim FGA and FTA rate hit era lows, and paint points fell from 47.05/game (2023-24) to 41.22 and 44.29 in the two seasons after. Hypothesis, not a measured finding: the aggregates are consistent with a finishing-personnel gap (a missing downhill finisher or vertical threat who converts penetration into restricted-area attempts and free throws). The scheme-design alternative is not excluded by this data; the player-level drive split in Next research steps is the discriminating test. What the data does say about roster building: adding more pull-up shooting duplicates the asset Boston already ranks top-4 in; the scarce asset is rim conversion.
Caveats
- Effective rating B: every first-shot number flows through the custom parser; reconciliation is excellent but the parser, not the NBA, defines possession boundaries.
- End-of-period heaves are included in first-shot metrics. Sensitivity (
data/processed/firstshot/heave_sensitivity.csv): excluding heaves (final 3 seconds of a period, 30+ ft) raises regular-season first-shot PPP by +.0011 to +.0058 depending on season and changes zero season ranks. 2025-26 had the fewest heaves of the era (14), so heave inclusion flatters 2025-26 slightly relative to other seasons, against the report's thesis. - The late-clock proxy overstates absolute late-clock share (inbound time on made-basket starts; untracked 14-second resets) and the bias moves with the start-reason mix; tracking buckets are quoted for levels and ranks, the proxy for within-era direction only.
- Playoff samples are small (289-1,732 first shots per run); single-season playoff PPP has SE ~0.03-0.06. Cross-season patterns (11 of 12, 11 of 11) carry the weight, not single seasons. The sign test is one-sided (two-sided doubles p); seasons share personnel and are not fully independent trials.
- Wins-vs-losses PPP gaps are partially tautological; composition shifts are the evidence, and per-season loss samples are 3-10 games.
- 2025-26 league playoff baselines lack a champion value (2026 Finals in progress at build time, NYK 3-1 SAS through 2026-06-10).
- Assisted rates exist only for makes; assisted-3 share is a biased subsample.
- Drives definition crosses three tracking vendors (2013-17 SportVU, 2017-23 Second Spectrum, 2023+ Hawk-Eye); treat cross-era drive levels as approximate.
- Two of 2,410 Celtics team-games carry 3-5 point source gaps (both New Orleans sides); no Boston rows affected.
- Playoff rows of
rim_pressure_proxyin the rim CSV are z-scored within the ~16-team playoff field and flagged in the notes column; only regular-season values are quoted here. - The deadball team-rebound convention (counted as chance-ending OREBs) removes a small, systematically late-clock-ish class of inbound shots from the first-shot pool.
Next research steps
- CEL-Q-005: league regular-season first-shot sample (~150 games/season) for a true RS league mean.
- CEL-Q-006: manual PBPV3 + shot-location chain build to classify collapse-created vs static threes on first shots.
- Player-level split of 2025-26 drives (who drove without generating rim attempts or fouls): separates the finishing-personnel hypothesis from the scheme-design alternative; all public (player drives + player shot charts).
- Half-court-only first-shot split (exclude steal/transition starts) to isolate the half-court creation problem Stevens most likely meant.
Message-board-ready short summary
Stevens said Boston had a hard time generating good first looks. The data: half true, and the true half is specific. Boston's first-shot efficiency was still strong in the regular season (1.119 points per first-shot attempt, fourth-best of their last 13 years). What broke is HOW they got first shots: the rim-pressure proxy (restricted-area rate + free-throw rate + drive rate vs league) ranked 30th of 30 two years running, rim attempts and free-throw rate hit 13-year lows, late-clock frequency was 2nd-highest in the NBA, and they ranked top-4 in pull-up three share, a proxy for shots you create yourself rather than shots created by a scrambled defense. They did not stop driving (47 drives/game, league average); the drives stopped converting into rim attempts and free throws. In the playoffs they got MORE three-heavy (52% of first shots, their highest ever) and lost a seven-game first-round series to Philadelphia in which their four losses produced 0.96 points per first shot on essentially the same shot mix as their wins. Not a turnover problem (best of their era), not a blown-lead problem (their lead possessions were their best possessions), not simply "too many threes" (the 2024 title team took nearly as many). The numbers point at creation quality and rim conversion, with one honest limit: public data cannot prove whether drives ended in kick-outs by necessity or by design. Their playoff first-shot efficiency still beat the playoff-field average, but it missed the final-four average two springs in a row, and champions live at the top of that list. The quote checks out as a diagnosis of process, not output.
Figures